
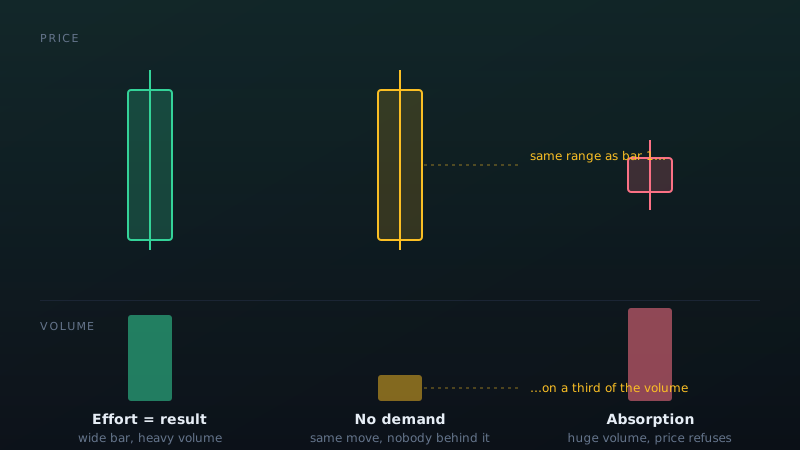
Most traders meet volume as a histogram along the bottom of the chart, decide it is either "high" or "low", and move on. Volume spread analysis asks a narrower and far more useful question: given how far this bar travelled and where it closed, was the volume behind it consistent with that result — or not?
That question is the whole of the method. Everything else — the named bar patterns, the terminology, the decades of literature — is scaffolding around it.
When effort and result disagree, something is happening that the price bar alone does not show. That single idea is the whole of VSA, and it is why the method survived the move from paper tape to Level II data without needing to be rewritten.
Where the method came from
The lineage runs through three people.
Richard Wyckoff, writing in the 1920s and 30s, was the first to formalise the idea that the market can be read as the behaviour of a single large operator accumulating and distributing stock. He set out three laws that still hold: supply and demand determine direction; the effort behind a move should be proportional to its result; and a cause must be built before an effect appears.
Tom Williams spent the 1960s and 70s working inside a syndicate trading room, watching how large positions were actually built. He later reverse-engineered what he had seen into a repeatable set of bar patterns, and gave the method its modern name.
The third contributor is less romantic but more consequential: the exchange data feed. What Wyckoff inferred from the tape, and Williams from the trading floor, a futures trader today can read directly from time and sales.
The three ideas volume spread analysis rests on
1. Effort versus result
A wide bar closing on its high, on heavy volume, is effort producing result — unremarkable. A wide bar closing on its high on light volume is something else: price moved because nobody was there to stop it, not because buyers were committed. The first bar is strength. The second is a bar that often gets retraced.
The inverse matters more. Very heavy volume producing a narrow bar means large orders were absorbed without price moving. Somebody with size took the other side. On a chart that is a single unremarkable candle; in the volume it is the loudest thing on the screen.
2. The close within the spread
VSA reads the close as a vote. A bar that ranges widely and closes in its lower third has, on balance, been rejected at the highs — regardless of whether the bar itself is green or red. Where the close sits within the range carries more information than the bar's colour, which only compares it to the previous close.
3. Context is not optional
No VSA signal means anything in isolation. Heavy volume on a narrow bar means accumulation near the bottom of a range and distribution near the top; the bar is identical, the conclusion is opposite. This is where most people go wrong with the method — they learn the patterns and skip the location.
What VSA looks like on a modern chart
Wyckoff read a tape. Williams read a floor. Both were reconstructing, by inference, information that a futures trader now receives directly. The principles did not change; the resolution did.
| VSA idea | What you can now measure directly |
|---|---|
| Effort versus result | Traded volume against bar range, per bar |
| Absorption | Bid and ask volume at each price inside the bar |
| Where activity concentrated | Volume profile, point of control, value area |
| Who was aggressive | Delta — market buys against market sells |
| Building a cause | Time spent at price, on a TPO or market profile chart |
A no-supply bar is still a no-supply bar. But instead of inferring that supply was absent from the shape of the candle, you can look at the ask volume that traded during it and see that it was.
Three mistakes worth avoiding
Treating volume as a signal on its own. Volume qualifies a price move; it does not generate one. A volume spike with no price context is a spike.
Using a data feed without true volume. On spot forex there is no central exchange, so "volume" is tick count from one broker's book — a proxy, and a different proxy per broker. VSA on futures uses real contracts traded. This is the single biggest reason the method appears to "not work" for some traders.
Reading one bar. Wyckoff's third law is about cause preceding effect. A market that has not built a cause is not about to produce an effect, however convincing today's bar looks.
Where volume spread analysis fits today
VSA gives you the questions. Order flow tools give you the resolution to answer them: a footprint chart shows the absorption that a narrow high-volume bar only implies, and a volume profile shows where the cause was built.
If you want to see what that looks like on a live chart, our volume and order flow tools for NinjaTrader 8 are built around exactly these questions.